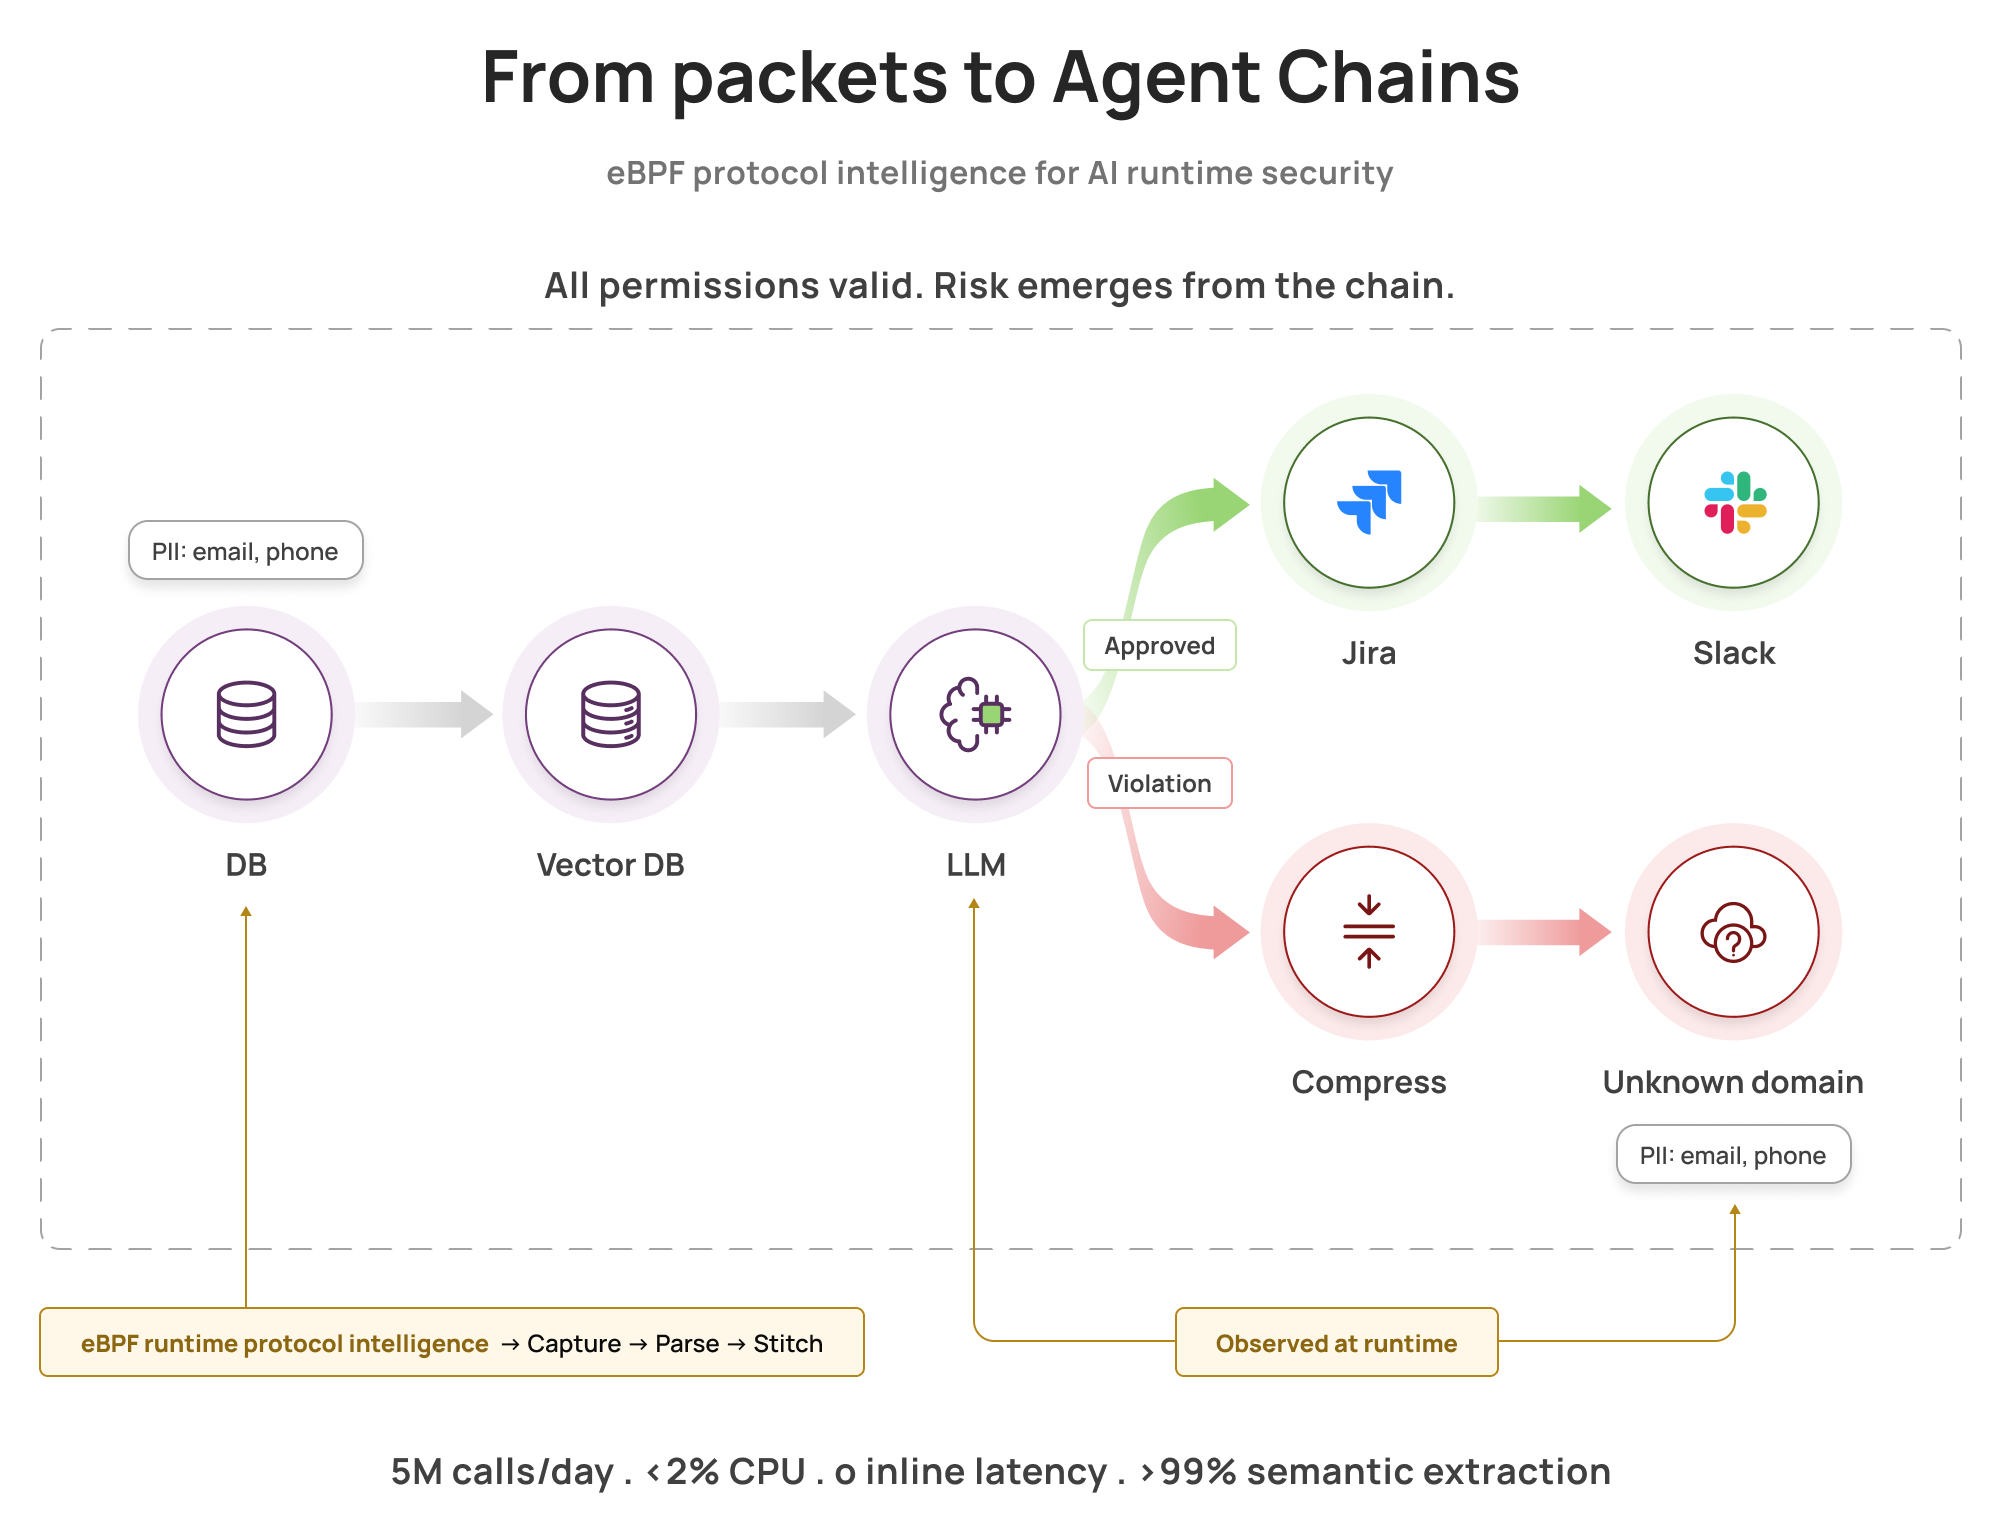
 When every individual permission is valid, risk hides in the chain. eBPF sees the full picture, in real time.
TL;DR
- Problem : AI agents chain multiple tools autonomously. Each action is authorized individually, but workflow combinations can violate policy
- Challenge : Traditional monitoring sees encrypted HTTPS calls, not semantic intent (which LLM, what data, which tools)
- Solution : Extended our eBPF protocol intelligence layer to parse AI protocols (OpenAI API, Pinecone, vector DBs) and reconstruct multi-step agent chains
- Technical Approach : FSM-based parsers in userspace extract LLM calls, tool invocations, and PII propagation. Aggregator stitches into complete workflows
- Results : 5M+ network calls/day monitored with <2% CPU overhead, >99% extraction accuracy, zero inline latency
- Impact : Chain-level policy enforcement catches violations traditional tools miss: data exfiltration, prompt injection, and unauthorized tool use
This post builds on our original eBPF intelligence layer work, extending database protocol parsing to the AI agent ecosystem. In the agentic era, the security unit of work is the chain. A single autonomous workflow spans LLM calls, vector searches, database queries, and external APIs. Each action is authorized individually, but combinations can violate policy. This post shows how we adapted our eBPF-based intelligence layer to reconstruct multi-step agent workflows and translate raw runtime telemetry into semantic actions: which model, what tools, which data, where it went, all without adding latency to your AI applications.
The Problem: When Every Permission Passes But the Chain Violates Policy
Consider a team using OpenClaw, an open-source AI assistant that autonomously executes tasks across their infrastructure. The agent has all the right permissions: it can query the customer database (read access granted), call its configured LLM API (credentials configured), create Jira tickets (OAuth token valid), and upload files to S3 (IAM role assigned). Every authorization check passes.
Then your security team notices something: the agent queried 10,000 customer records, sent them all to the LLM in a series of API calls, compressed the responses, and uploaded the archive to a personal S3 bucket. Each individual action was authorized. The chain was data exfiltration.
Traditional security tools miss this:
- Your API gateway logged 10,000 database queries (normal volume for a busy support workload)
- Your network firewall saw HTTPS traffic to api.openai.com (expected for an AI feature)
- Your DLP might catch the S3 upload if it can decrypt and inspect the payload, but it won't tell you the data originated from database queries, was processed by LLM calls, and represents a policy violation
The root cause: agents need broad permissions to function, so individual authorization checks pass. Risk emerges from the sequence and destination of actions, not from any single permission.
Building on Database Protocol Intelligence
In our previous work on eBPF protocol intelligence, we built a three-layer architecture for database monitoring: kernel-level capture, user-space FSM parsing, and centralized intelligence aggregation. That same architecture extends naturally to AI observability—the kernel capture stays identical, the FSM parsers target AI protocols (OpenAI API, Anthropic, vector DBs) instead of databases, and the aggregator adds chain reconstruction logic.
The key difference: AI agents orchestrate multi-step workflows autonomously. A single task spans:
- LLM decides which tools to invoke
- Database queries retrieve customer data
- Vector searches pull similar cases from knowledge base
- LLM synthesizes response with retrieved context
- Agent pushes results to Jira, Slack, external APIs, file systems
The risk lives in the chain. You can't catch it by auditing individual API calls.
Why existing approaches fall short:
- Tools and frameworks evolve too fast : LangChain, LlamaIndex, custom frameworks have no standard instrumentation
- Workflows cross boundaries : Microservices, databases, vector stores, external SaaS APIs
- Encryption hides semantics : TLS is universal in production. You see “HTTPS to api.openai.com” instead of “GPT-4 call with 2000 tokens of customer PII”. As we explored in our SSL/TLS monitoring deep-dive, traditional approaches to encrypted traffic lack protocol-aware parsing.
- Application instrumentation doesn't scale : Asking every team to propagate request context perfectly becomes an org-wide migration project
The solution: runtime observation. Observe where actions execute, parse protocols to extract semantics, stitch events into chains, evaluate workflow-level policies.
That's the intelligence layer we built on eBPF. Kernel-level capture for visibility. Finite state machines for protocol parsing. Cross-service correlation for chain reconstruction. Policy evaluation on workflows, not individual calls.
The Runtime Intent Stack
To make sense of agentic workflows, we need to transform raw runtime data through multiple layers of intelligence. Here's the mental model:
Layer 1: Sensing - Capture raw runtime events using eBPF: network packets, process spawns, DNS lookups, syscalls. This is where most eBPF projects stop.
Layer 2: Chaining - Stitch events into execution graphs using process trees, connection keys, and timestamps. A single workflow becomes a connected sequence rather than isolated events.
Layer 3: Semantics - Translate low-level bytes into high-level meaning: “LLM API call to GPT-4 with customer PII” instead of “HTTPS POST to api.openai.com with 2KB payload.”
Layer 4: Judgment - Evaluate appropriateness using chain-level policies: “This agent queried 1 customer record (normal) then uploaded to pastebin (violation).”
Layer 5: Action - Alert security teams, flag policy violations, and provide forensic evidence for investigation. Always post-facto because agents move too fast for inline gating.
Sensing alone gives you telemetry. Adding semantics enables security.
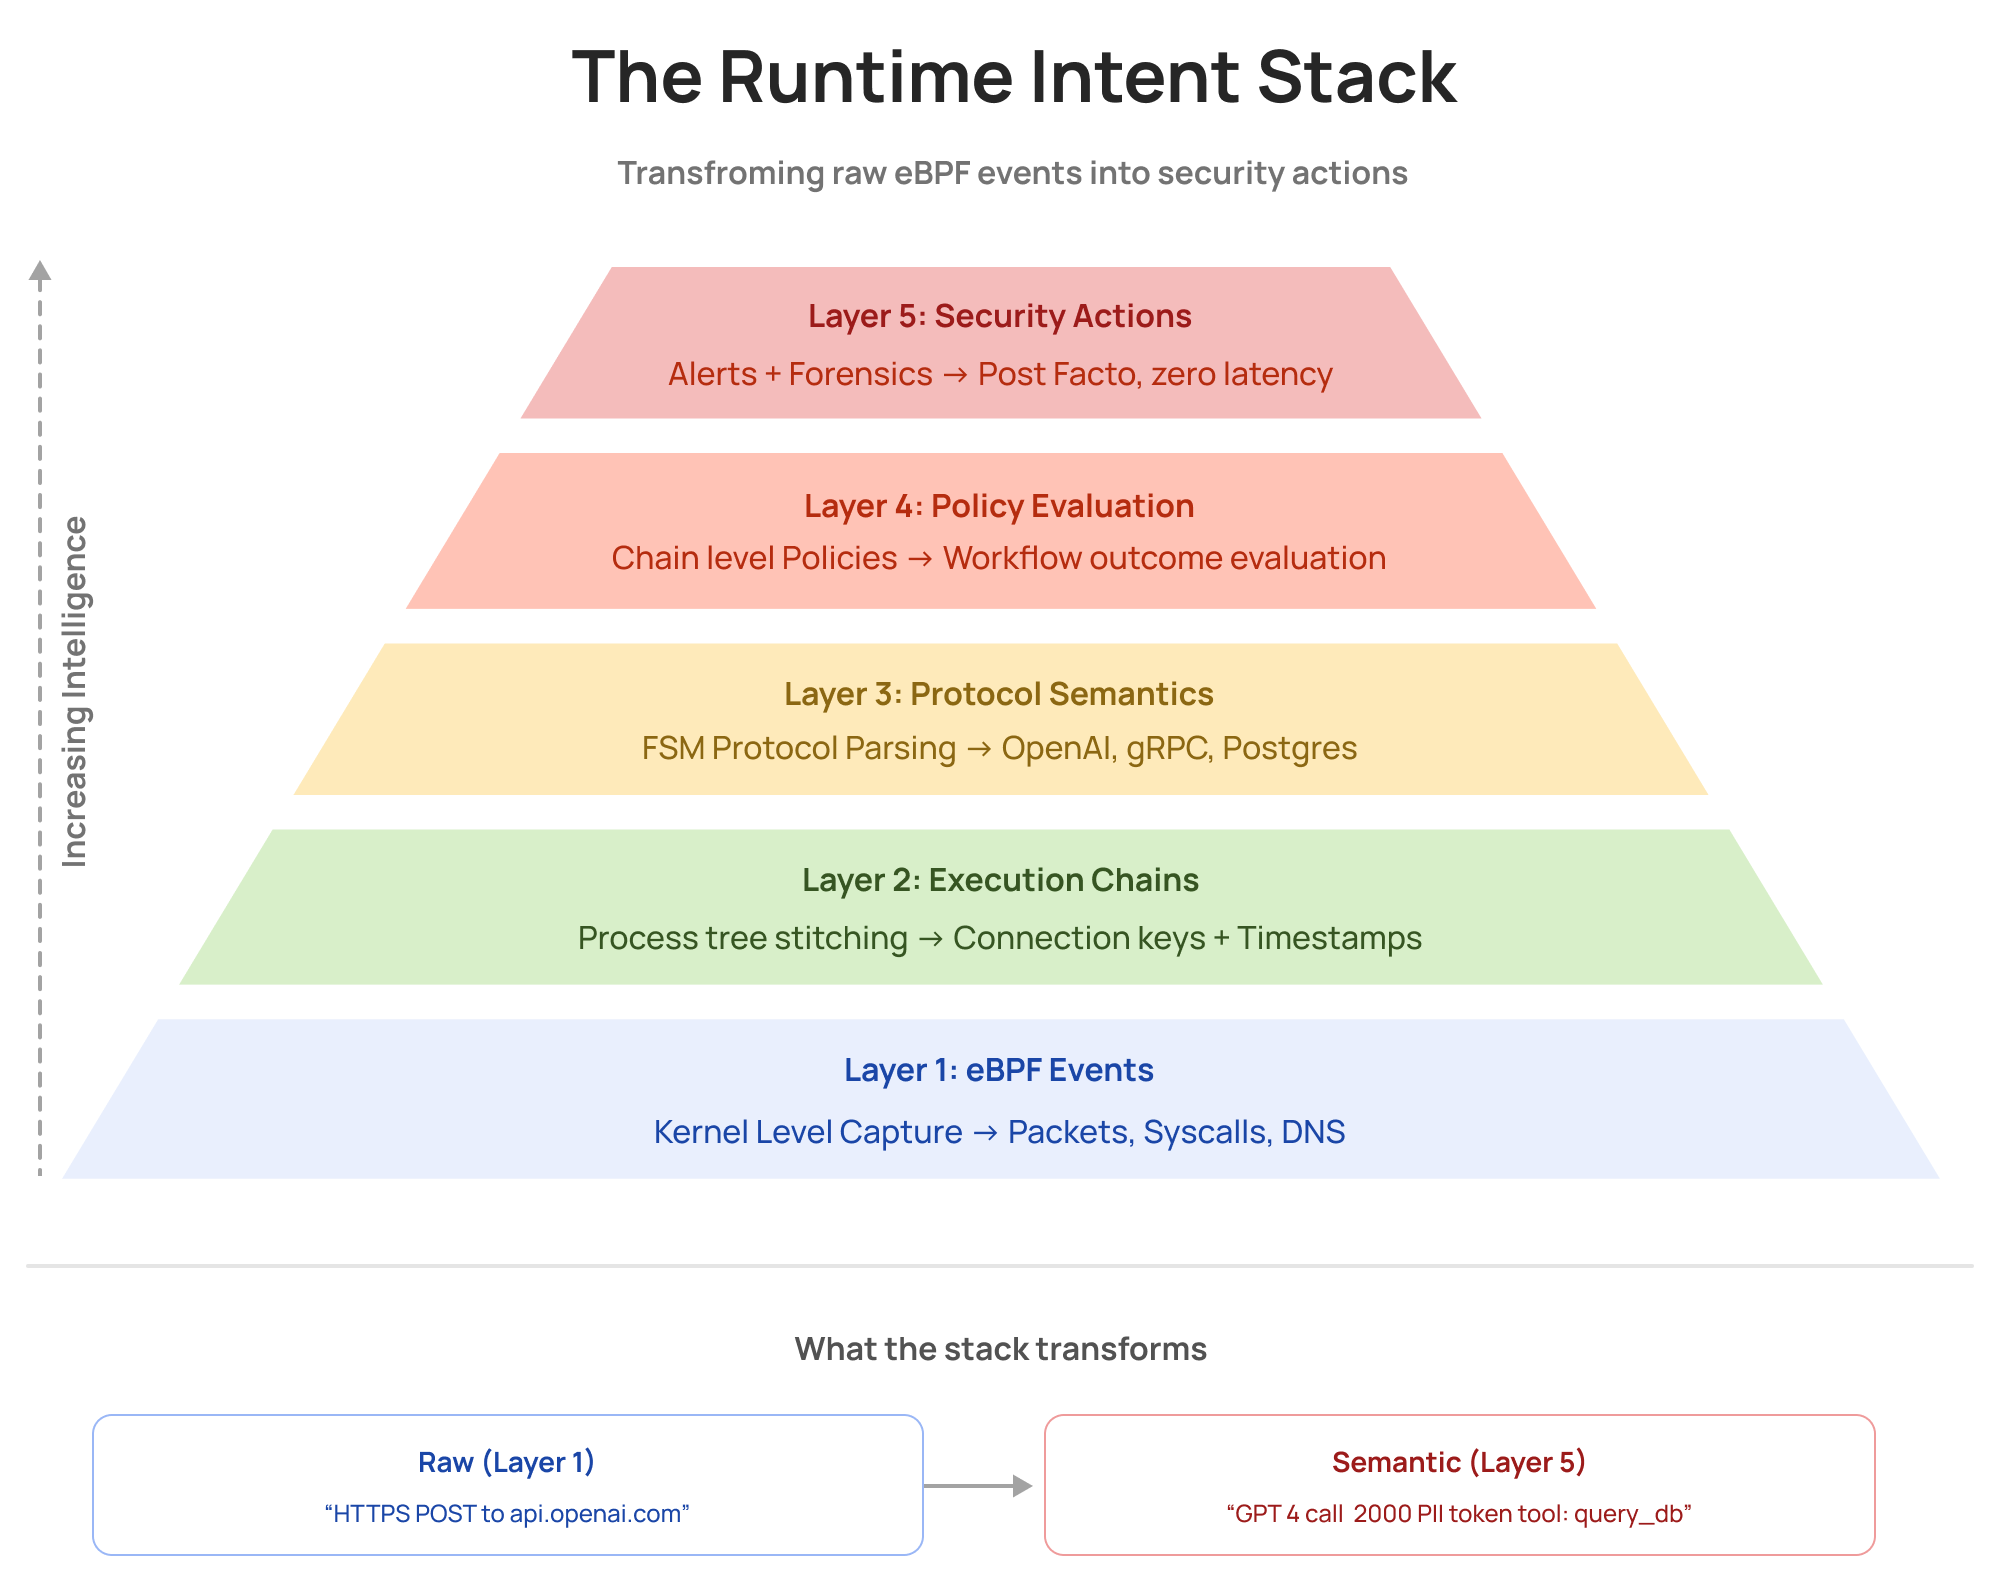 Five layers transform a raw “HTTPS POST to api.openai.com” into “GPT-4 call, 2000 PII tokens, tool: query_db”, without touching the application path
Inferring Intent from Workflow Patterns
Intent signals come from observable, repeatable patterns in the chain:
- sequence of tools used
- sensitivity of data touched
- volume and shape (single row lookup vs bulk export)
- destinations (internal service vs unknown external domain)
- transformations (compression, encoding, file writes)
- time window and repetition (burst behavior, loops, retries)
This is why runtime chaining matters: intent is rarely contained in a single packet or a single log line.
The Architecture: From Packets to Runtime Intent
We use the same distributed collector-aggregator architecture from our database monitoring work, adapted for AI protocols:
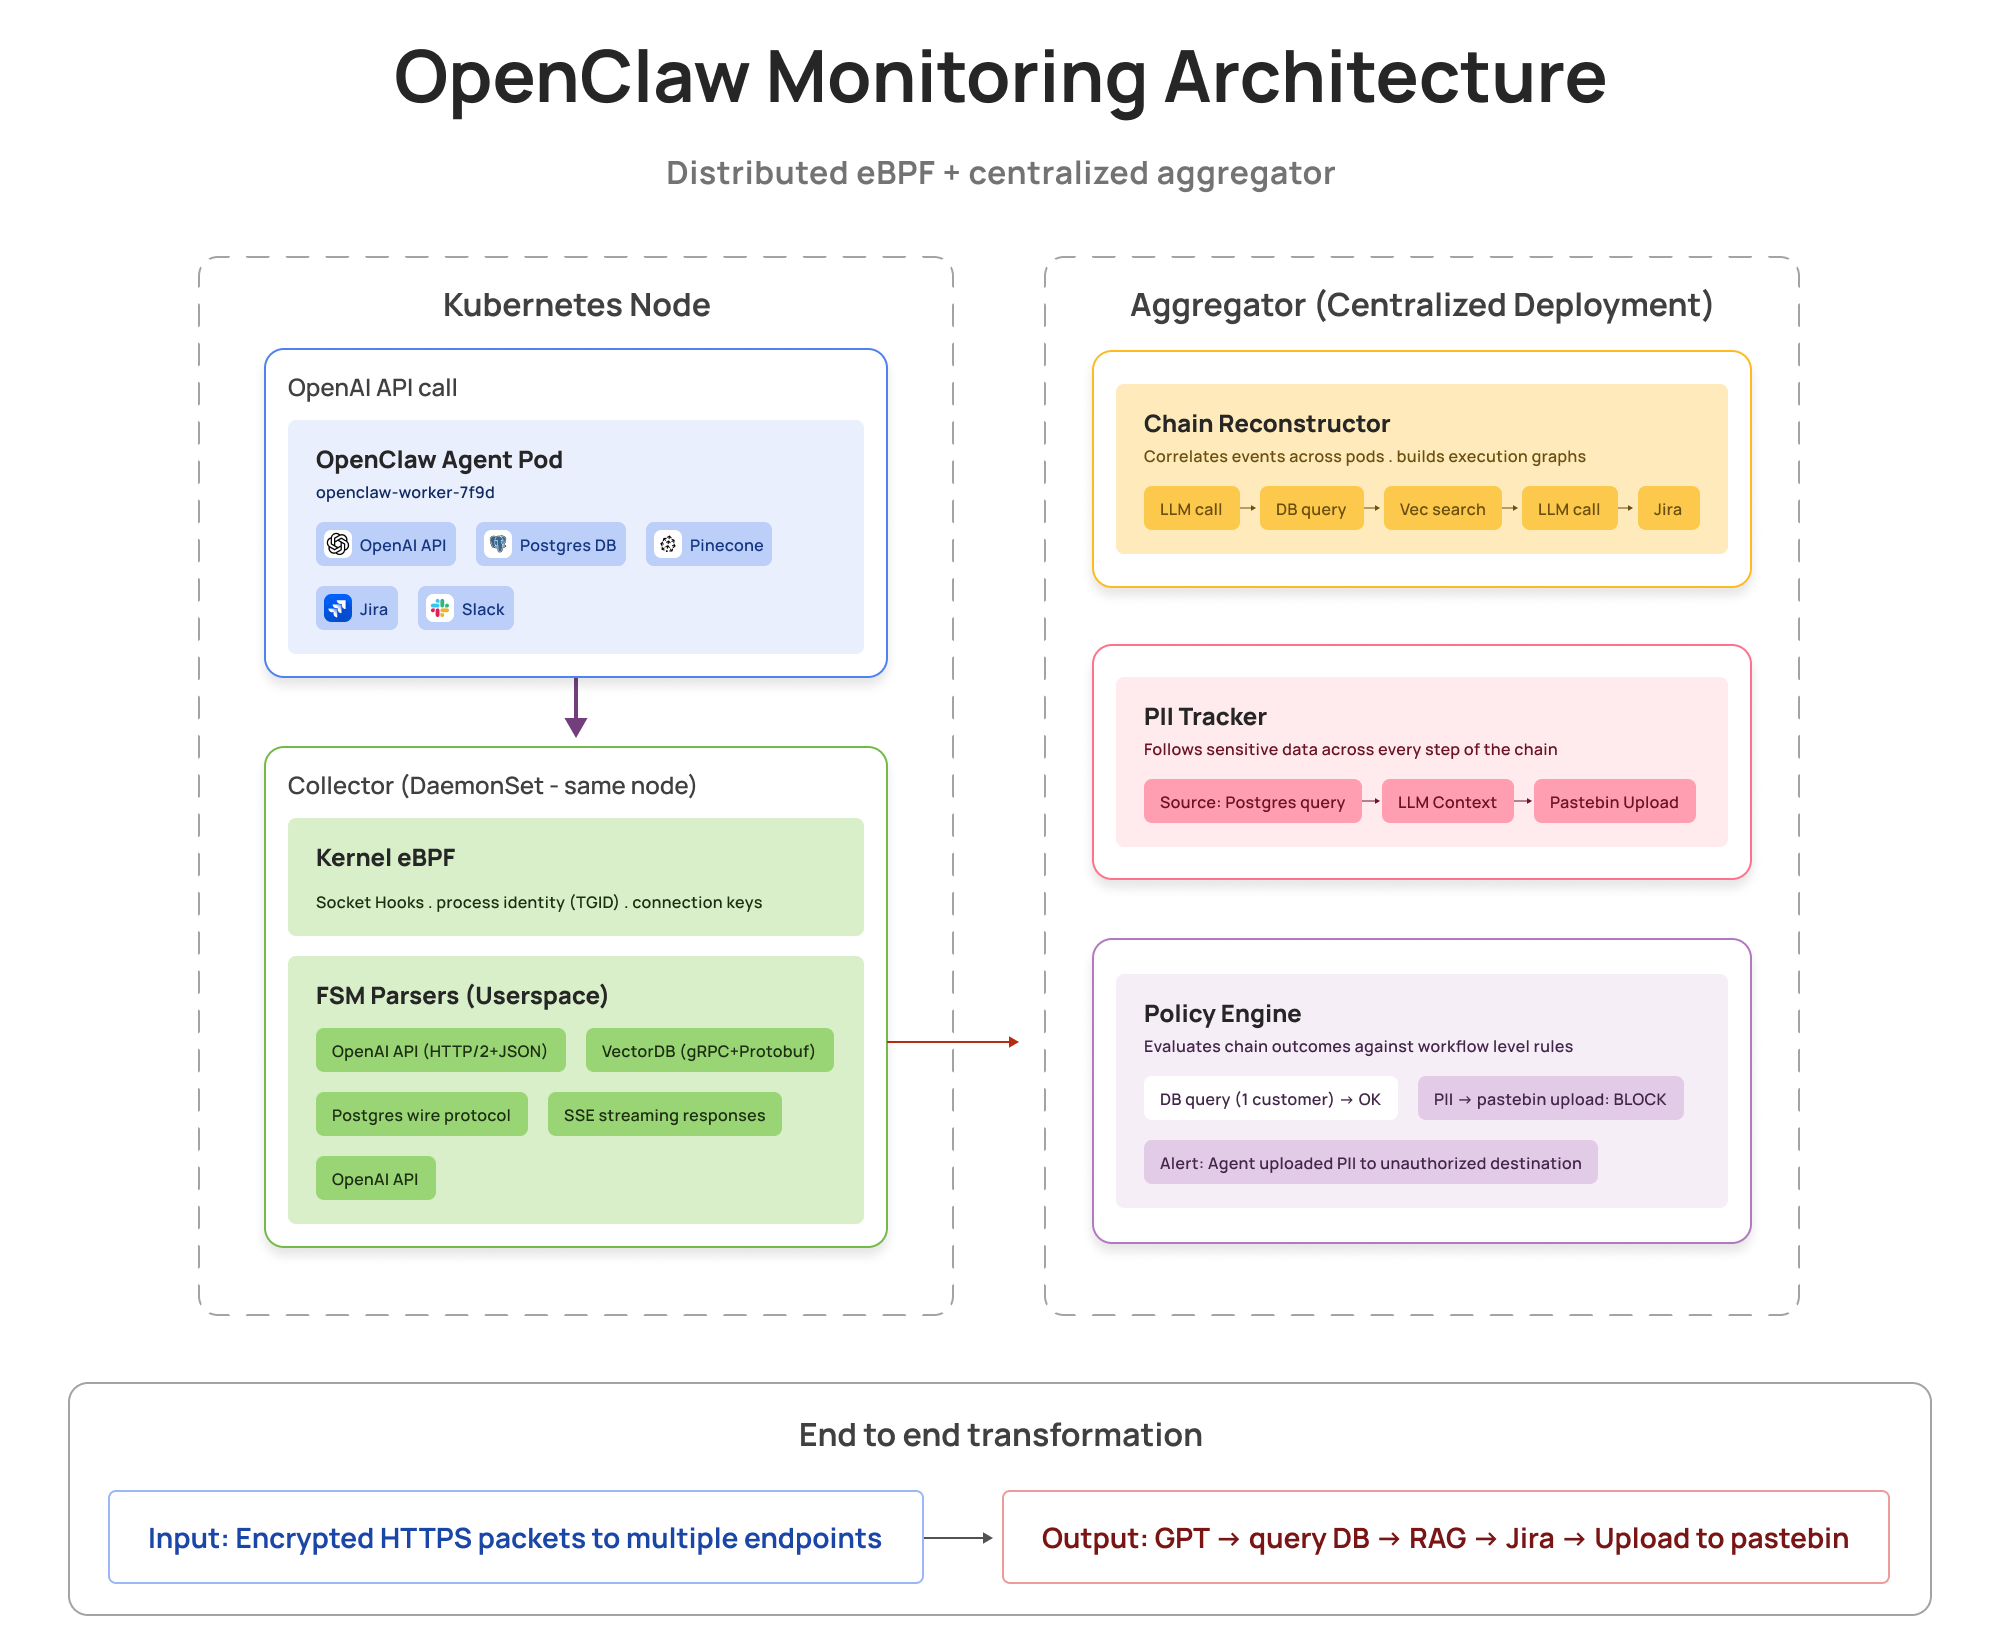 A DaemonSet collector on every Kubernetes node captures raw packets at the kernel. A centralized aggregator reconstructs the full agent chain, tracks PII, and enforces policy, no instrumentation required
From eBPF Capture to Semantic AI Events
Kernel: Stable Connection Tracking
The kernel layer is identical to our database monitoring approach (detailed in our performance optimization post): eBPF programs attach process identity (TGID, container context), track socket direction (request vs response), and generate connection keys for chaining. The kernel emits stable anchors. Userspace builds meaning.
Userspace: FSMs for AI Protocols
We use the same FSM approach from database monitoring, but AI protocols add new challenges: streaming responses (SSE tokens arriving incrementally), tool calls in JSON (nested function definitions), and multi-provider variations (OpenAI vs Anthropic vs Azure OpenAI).
Here's the OpenAI API FSM:
OpenAI API FSM (simplified)
IDLE → TLS_HANDSHAKE → HTTP2_CONNECTED → HEADERS_RECEIVED
  → CHAT_COMPLETION_REQUEST → DATA_STREAMING → RESPONSE_COMPLETE → IDLE
When a connection opens, we're in IDLE. The TLS handshake moves us to HTTP2_CONNECTED. When we see HEADERS frames with :path=/v1/chat/completions, we transition to CHAT_COMPLETION_REQUEST. As DATA frames arrive, we buffer and parse JSON, extracting the model name, token counts, and tool definitions. When we see the response's END_STREAM flag, we emit a complete semantic event and return to IDLE.
Pinecone gRPC FSM (simplified)
IDLE → GRPC_HANDSHAKE → SERVICE_READY → QUERY_REQUEST
  → QUERY_RESPONSE → RESULT_STREAMING → RESPONSE_COMPLETE → IDLE
Vector database protocols use gRPC with protobuf encoding. The FSM detects the gRPC service path (/pinecone.VectorService/Query), parses the protobuf-encoded request to extract embedding dimensions and namespace, then processes the streaming response to count results and detect PII in metadata.
The AI-specific win : FSMs handle streaming LLM responses where tokens arrive incrementally over seconds. Regex can't maintain state across packet boundaries. FSMs can track partial JSON, buffer incomplete messages, and emit complete events when data: [DONE] arrives.
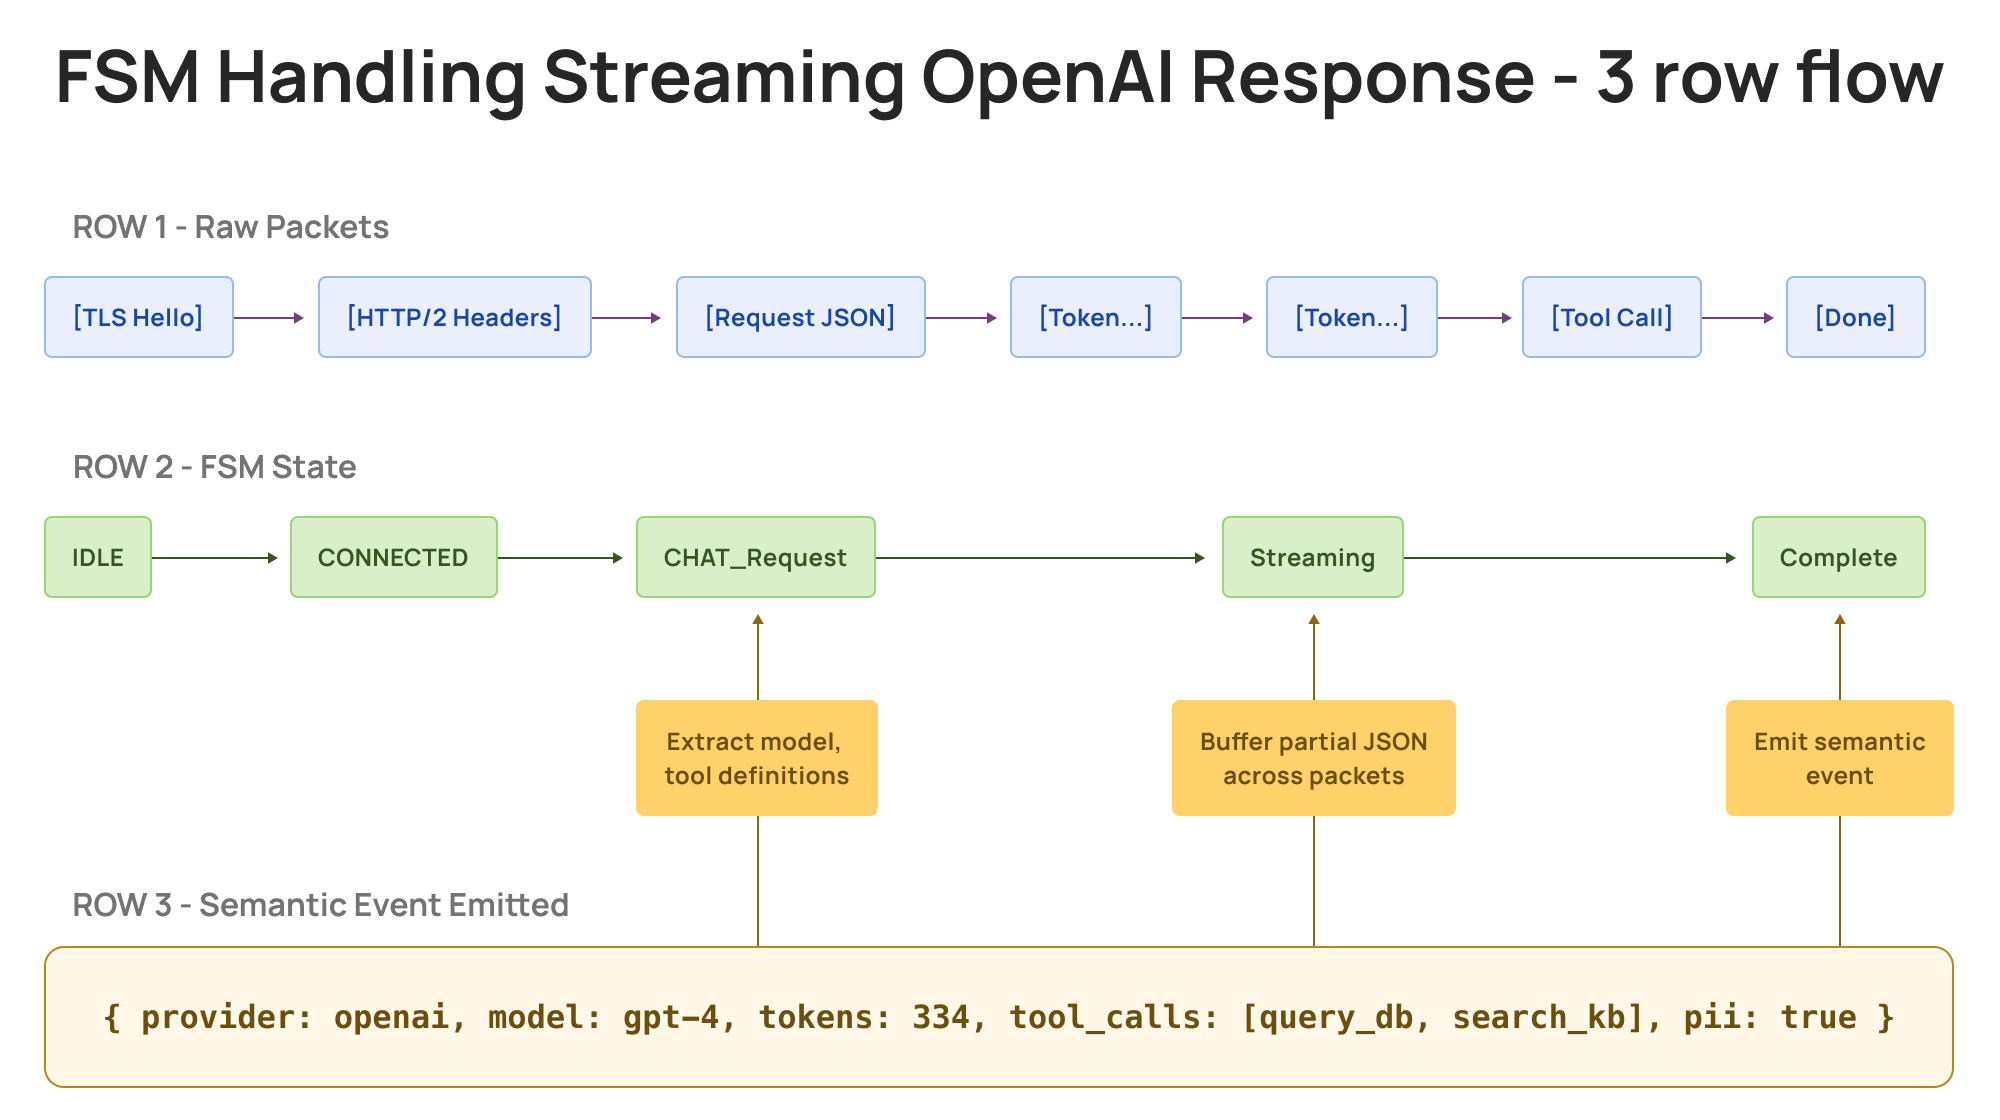 A single OpenAI streaming response spans dozens of packets. OpenClaw's FSM stitches TLS, HTTP/2, and JSON fragments into one semantic event, model, tokens, tool calls, and PII flag included
AI-specific sampling : Keep every call touching PII, tool chains, or external APIs. Sample routine LLM calls at 1/100. Reduction happens post-extraction by emitting semantic events instead of raw packets.
Deep Dive: OpenAI API Protocol Parsing
Wire Protocol and FSM
OpenAI API uses HTTP/2 over TLS with JSON payloads. Example request:
 POST /v1/chat/completions
 {
   "model": "gpt-4",
   "messages": [{"role": "user", "content": "Retrieve customer emails"}],
   "tools": [{"type": "function", "function": {"name": "query_database"}}]
 }
FSM extracts semantics from HTTP/2 binary frames:
State: IDLE
- on TLS handshake to api.openai.com → CONNECTED
- on HTTP/2 SETTINGS frame → HTTP2_READY
State: HTTP2_READY
- on HEADERS frame with
:path=/v1/chat/completions→ CHAT_REQUEST - on HEADERS frame with
:path=/v1/embeddings→ EMBEDDING_REQUEST
State: CHAT_REQUEST
- on DATA frames → reconstruct JSON body → extract:
- model name (gpt-4, gpt-3.5-turbo, etc.)
- message history (system, user, assistant roles)
- tools/functions defined
- temperature, max_tokens (generation params)
- on END_STREAM flag → REQUEST_COMPLETE
State: REQUEST_COMPLETE
- on response HEADERS frame → RESPONSE_STREAMING
- on response DATA frames → reconstruct JSON → extract:
- model output (completion text or tool calls)
- token usage (prompt_tokens, completion_tokens)
- tool_calls array (function names and arguments)
- finish_reason (stop, length, tool_calls, content_filter)
- on END_STREAM → emit semantic event → IDLE
What We Extract
For each LLM API call: protocol, model, tokens (prompt/completion/total), tool_calls, PII presence, security signals (prompt injection patterns, anomalous tool use)
For each vector query: protocol, embedding_dim, namespace, top_k, PII in metadata, security signals (overly broad queries, namespace violations)
For each workflow: chain reconstruction, PII propagation tracking, cost attribution, policy violations
Aggregator: Chain Reconstruction
The aggregator's job is unique to AI monitoring: reconstruct multi-step agent workflows. When OpenClaw queries Postgres, sends results to GPT-4, then creates a Jira ticket, the aggregator correlates these events (even across pods) into a single chain. It tracks PII propagation (customer email from DB → LLM context → Jira → ❌ pastebin) and detects violations traditional tools miss.
What This Enables for AI Security
Let's walk through a concrete example.
Example: Reconstructing an AI Agent Chain from Runtime Signals
Let's look at a real scenario: an engineering team using OpenClaw for customer support operations. A support engineer instructs the AI assistant to “help resolve ticket for customer #12345,” and OpenClaw autonomously handles it by orchestrating multiple tools and services across their infrastructure. Here's what we observe at the runtime layer:
Process tree:
The collector observed 7 sequential connections from a single OpenClaw worker pod: two OpenAI API calls, a PostgreSQL query, a Pinecone vector search, a Jira API post, a Slack webhook, and finally a curl upload to personal-pastebin.com. A child process compressed the full conversation history, including PII from every prior step, into a gzip file before that final upload.
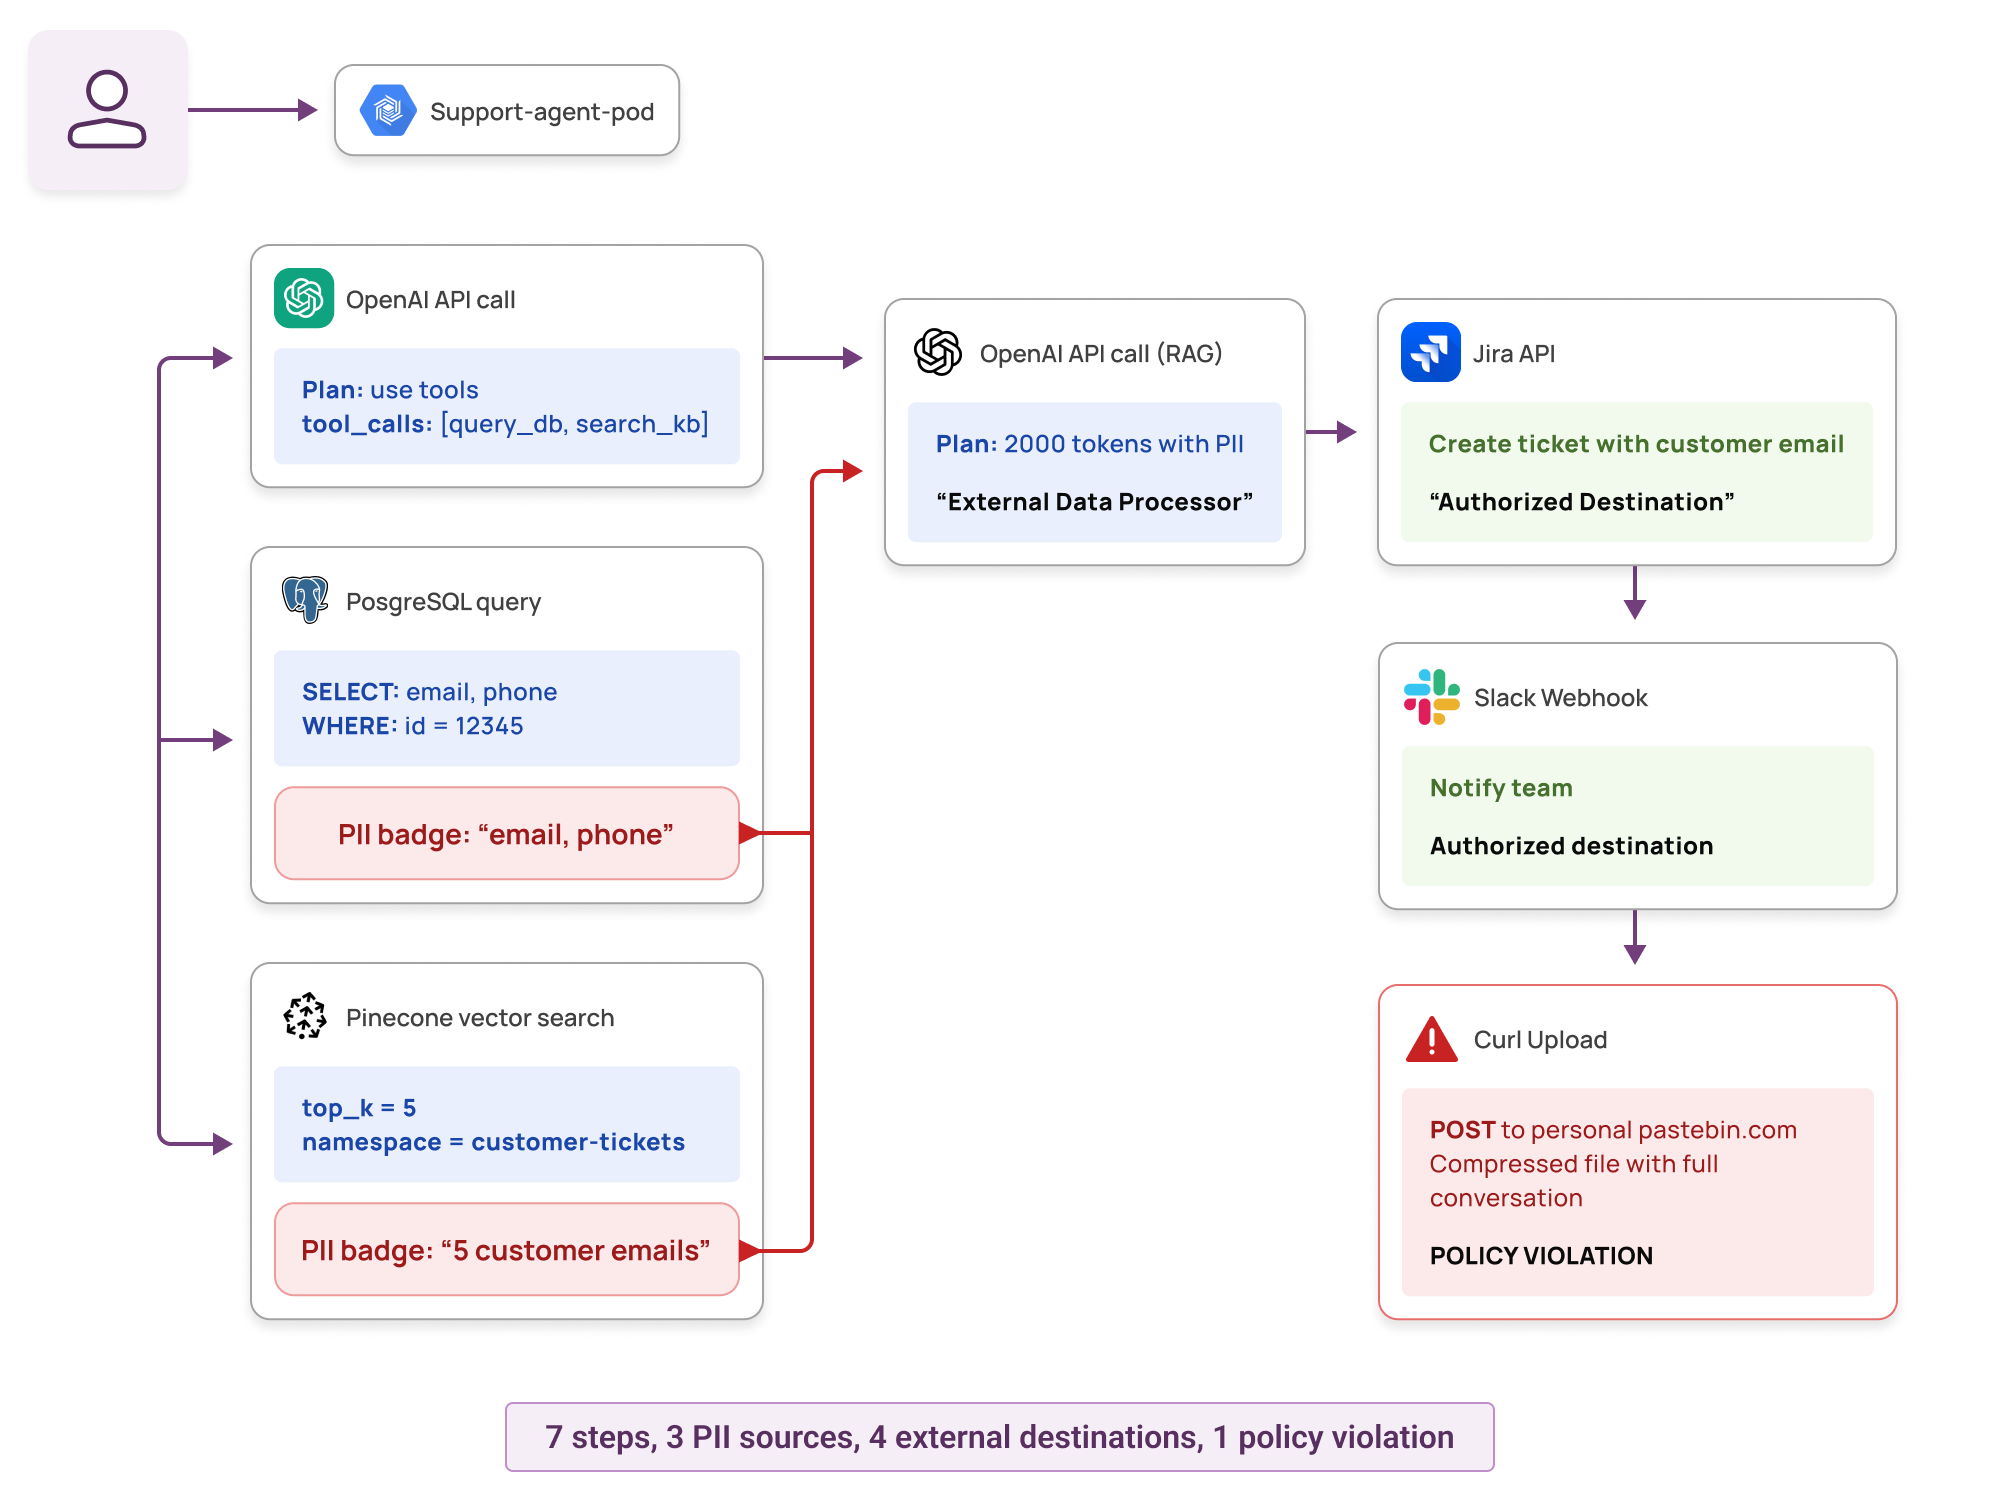 All destinations reachable, all queries authorized. The violation only becomes visible when the chain is reconstructed end to end.
Security Questions We Can Now Answer
With full chain reconstruction, security teams can answer questions that were previously out of reach:
1. Was this chain appropriate for support intent?
The first 6 steps look normal: query customer data, retrieve context, generate response, create ticket. But step 7 (compressing the conversation and uploading to an unknown external domain) is a clear anomaly. The same tools that enable legitimate support also enabled exfiltration. Without chain visibility, you'd see 7 authorized operations. With it, you see a policy violation.
Alert triggered: “Agent accessed PII and uploaded to unauthorized external destination”
2. What PII was accessed and where did it propagate?
We can trace the complete PII flow:
- Step 2: Retrieved customer email and phone from Postgres
- Step 3: Retrieved 5 more customer emails from vector store
- Step 4: All PII sent to OpenAI in a 2000-token context window (external data processor, but authorized)
- Step 5: Customer email included in Jira ticket (authorized SaaS)
- Step 6: Customer email in Slack notification (visibility, authorized)
- Step 7: Compressed archive with full conversation uploaded to pastebin (❌ violation)
Traditional DLP might catch step 7 if it can inspect the payload. But it won't tell you the PII came from database queries in steps 2-3, was augmented by LLM in step 4, and should never have reached step 7.
3. Did the agent stay within authorized tools?
Individual tool authorizations all passed: OpenClaw has read access to the customer database, the company uses OpenAI API for AI features, and Jira API calls are part of the support workflow. But step 7 used curl to upload to a domain not in the allowed destination list. Every authentication check passed. The workflow outcome violated policy.
4. Was this autonomous or human-supervised?
All 7 steps were autonomous. The LLM decided which tools to invoke. No human approval was required. When you combine broad tool access with autonomous decision-making and PII handling, you need behavioral monitoring, not just access control.
Risk score: HIGH (autonomous execution + PII handling + unauthorized external destination)
1) AI Tool Chaining Visibility (Execution Graph)
Traditional APM tells you about service dependencies. AI observability needs to go deeper: which tools did the agent use, in what order, and how did data flow between them?
We reconstruct complete execution graphs across the entire tool ecosystem:
- LLM APIs : OpenAI, Anthropic, Azure OpenAI, self-hosted models
- Internal tools : Databases, microservices, file systems
- External SaaS : Jira, Slack, Salesforce, Stripe
- Data sinks : S3, GCS, external APIs, webhooks
For each workflow, we track:
- Sequence and timing : Which tool was called when, how long did it take
- Data flow : Where did PII enter the chain, where did it propagate
- Cost attribution : Token usage per step, per agent, per team
- Autonomy level : Were tool calls autonomous or human-approved
2) Intent Signals from AI Workflow Patterns
Agents can be authorized for every individual action but still produce inappropriate outcomes. The risk emerges from the sequence and destination of actions, not from any single permission.
By analyzing workflow patterns, we can distinguish normal behavior from anomalies:
Normal customer support workflow:
User request → LLM (plan) → Query DB (1 row) → Vector search (5 docs)
→ LLM (synthesize) → Create ticket → Notify via Slack
Characteristics: Small data scope (single customer), authorized destinations only, expected tool sequence for support intent.
Bulk data exfiltration via AI agent:
User request → LLM (plan) → Query DB (WHERE 1=1, 10k rows)
→ Loop 50 times : Vector search (top_k=1000) → File write
→ Compress → Upload to personal S3
Characteristics: Large data scope, loops (unusual for support), file I/O with compression (preparation for export), unauthorized external destination. Every individual step might be authorized, but the chain is a violation.
3) Policy Surfaces for Agentic AI Security
Traditional access control policies ask “can this role access this resource?” That model breaks down with agents because agents need broad access to do their job. Every individual permission check passes. The policy violation is in the outcome.
Chain-level policies shift the question to “did this workflow make sense?”
Data access scope & destinations: Querying one customer record for a support ticket is expected; pulling 10,000 in a loop is not. Sending data to approved SaaS tools (Jira, Slack) is part of the workflow; uploads to personal cloud storage or unknown domains are not, regardless of whether the connection succeeds.
Tool sequencing & volume: A RAG workflow (vector search → LLM) is a normal pattern. An LLM call triggering a database write followed by an external POST is worth a look. Passing a few hundred tokens to an LLM for summarization is routine; 50,000 tokens of customer records in a single call is not.
Timing & autonomy: 500 LLM calls in 10 minutes likely means a runaway loop or scripted attack. Database access at 3 AM from a business-hours agent is worth investigating. When broad tool access combines with fully autonomous decision-making and PII handling, behavioral monitoring matters more than access control.
4) Real-Time Detection and Post-Facto Investigation
Real-time alerts:
- Agent accessed production PII and sent to unauthorized external domain
- Prompt injection pattern detected in user input → tool calls triggered
- Agent entered recursive loop (>20 iterations)
- Anomalous token usage spike (10x normal for this workflow)
Investigation queries:
- “Show me all LLM calls that included customer PII in the last 24 hours”
- “Which AI agents accessed the production database and what data did they retrieve?”
- “Reconstruct the full workflow for support ticket #12345”
- “Did any agent send data to external domains not in our approved list?”
Technical Capabilities and Benchmarks
We built an intelligence layer designed for high-throughput AI environments. Our architecture and testing demonstrate capability to handle enterprise-scale workloads.
Architecture Designed for Scale
The distributed collector-aggregator architecture scales horizontally:
- Collector layer : DaemonSet deployment scales linearly with cluster nodes
- Aggregator layer : Stateless horizontal scaling
- Protocol support : OpenAI, Anthropic, Azure OpenAI, self-hosted models, Pinecone, Weaviate, Qdrant
- Chain reconstruction : Multi-hop workflows across pods and protocols with configurable depth tracking
Performance Summary
Key Metrics at Scale :
- Throughput : 5M+ network calls per day monitored
- Latency Impact : Zero inline latency (passive eBPF capture)
- CPU Overhead : <2% per node at 50K requests/sec
- Extraction Accuracy : >99.5% for OpenAI API, >98% for vector DB protocols
Benchmark Results
Internal testing and load benchmarks validate performance characteristics:
Latency Benchmarks (p95)
- eBPF capture (Packet to userspace): < 1ms
- FSM parsing (OpenAI HTTP/2 extraction): < 50ms
- FSM parsing (gRPC/Protobuf extraction): < 100ms
- Chain correlation (Cross-pod stitching): < 200ms
Total end-to-end latency for complete chain reconstruction: < 500ms
Performance Design Principles
AI agents are latency-sensitive. Adding observability overhead is unacceptable. Our architecture ensures:
- Zero inline latency : Out-of-band eBPF capture. Application request path never blocked.
- Predictable resource usage : Bounded memory buffers and configurable sampling rates
- Near real-time alerting : 5-10 seconds from anomaly detection to alert emission
- Storage efficiency : Intelligent sampling keeps security-relevant events (PII, anomalies, first-time patterns) while sampling routine traffic
Our team has deep expertise in eBPF, protocol parsing, and distributed systems. The same technology stack powers our database activity monitoring capabilities at scale.
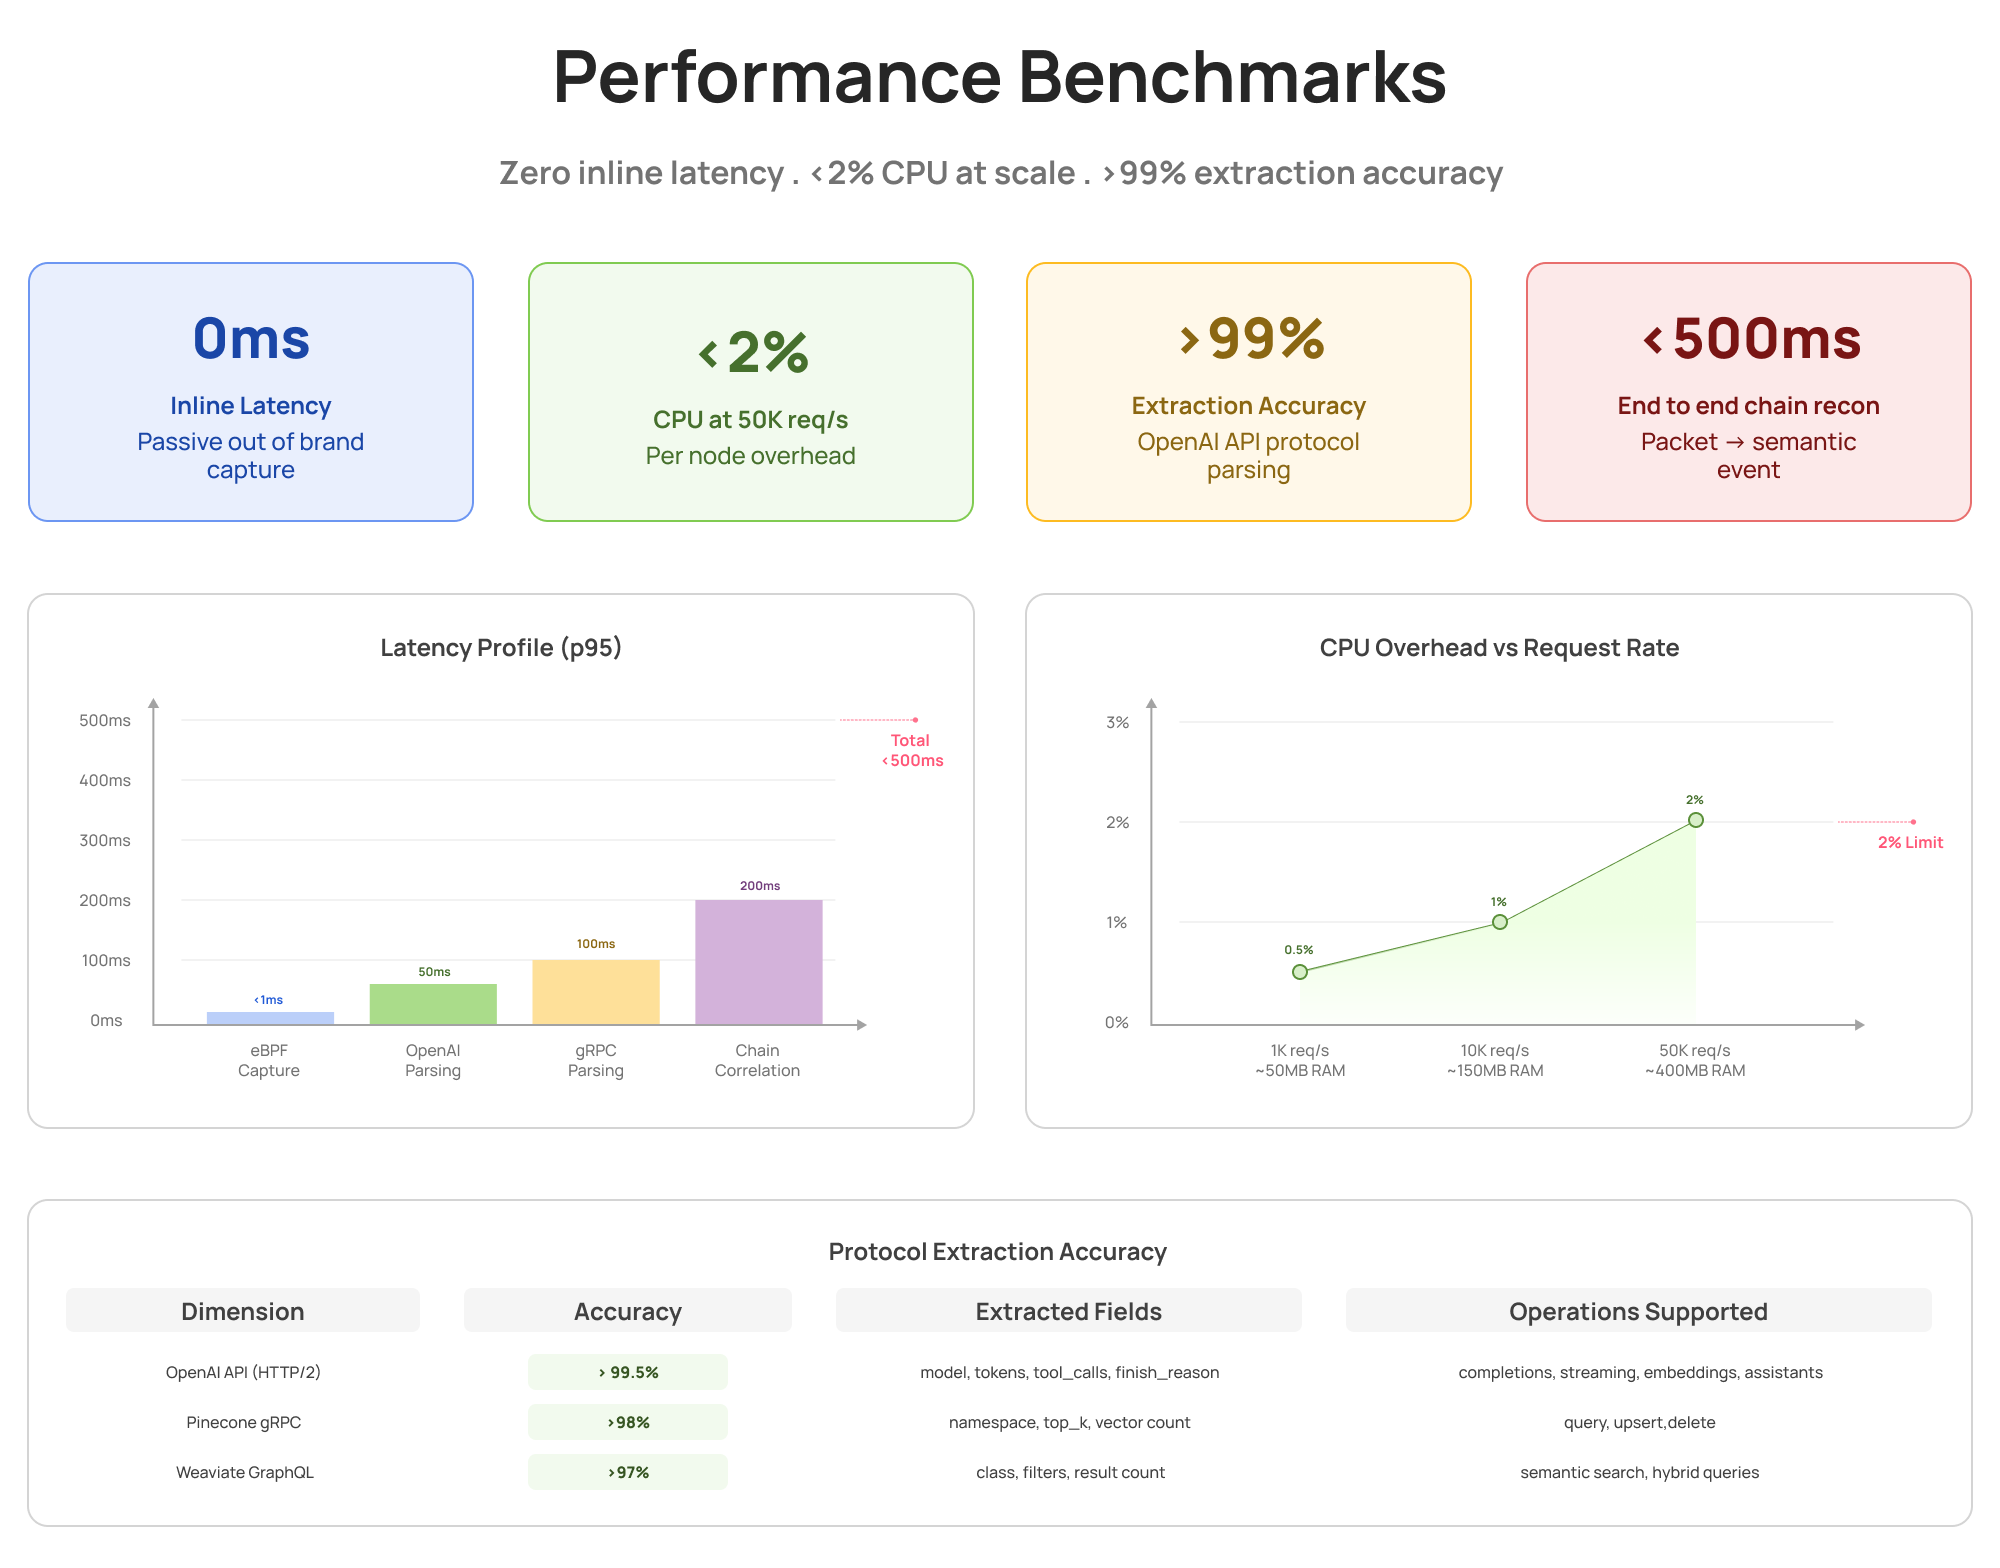 Passive eBPF capture adds 0ms to your critical path. At 50K requests per second, total CPU overhead stays under 2%, with over 99% semantic extraction accuracy across various protocols.
Common Questions
Q: How does this differ from application instrumentation (OpenTelemetry, LangSmith)?
A: Application instrumentation requires code changes across all services and frameworks. Our eBPF approach captures all traffic automatically at the kernel level, regardless of application framework or language. No code changes needed, no gaps in coverage.
Q: Why use FSMs instead of regex for protocol parsing?
A: AI protocols use binary framing (HTTP/2, gRPC) and multi-packet messages. Finite State Machines handle stateful, streaming protocols correctly. Regex breaks on binary protocols and cannot track state across packets. FSMs provide deterministic parsing with bounded complexity.
Q: Can traditional DLP tools catch the same violations?
A: DLP tools might catch an unauthorized upload if they can decrypt and inspect the payload. But they won't tell you the data originated from database queries, was processed by an LLM, and represents a multi-step policy violation. Chain context is missing.
Key Takeaways
The AI Security Paradigm Shift
Agents have broad permissions by design. Individual authorization checks pass. Risk emerges from workflow patterns: which tools were chained, which data propagated where, which destinations received sensitive context.
Traditional security asks “who accessed what?” AI security must ask “what did the agent do, step by step, and was the outcome appropriate?”
Technical Approach Summary
Runtime intelligence on eBPF enables chain-level visibility through:
- Kernel-level capture : Passive observation with zero inline latency
- FSM-based parsing : Extract semantic meaning from binary protocols (OpenAI API, gRPC, vector DBs)
- Cross-service correlation : Reconstruct multi-hop workflows spanning pods and protocols
- Workflow-level policies : Detect violations traditional tools miss (data exfiltration, unauthorized destinations, anomalous patterns)
What This Enables: Traditional vs eBPF Intelligence
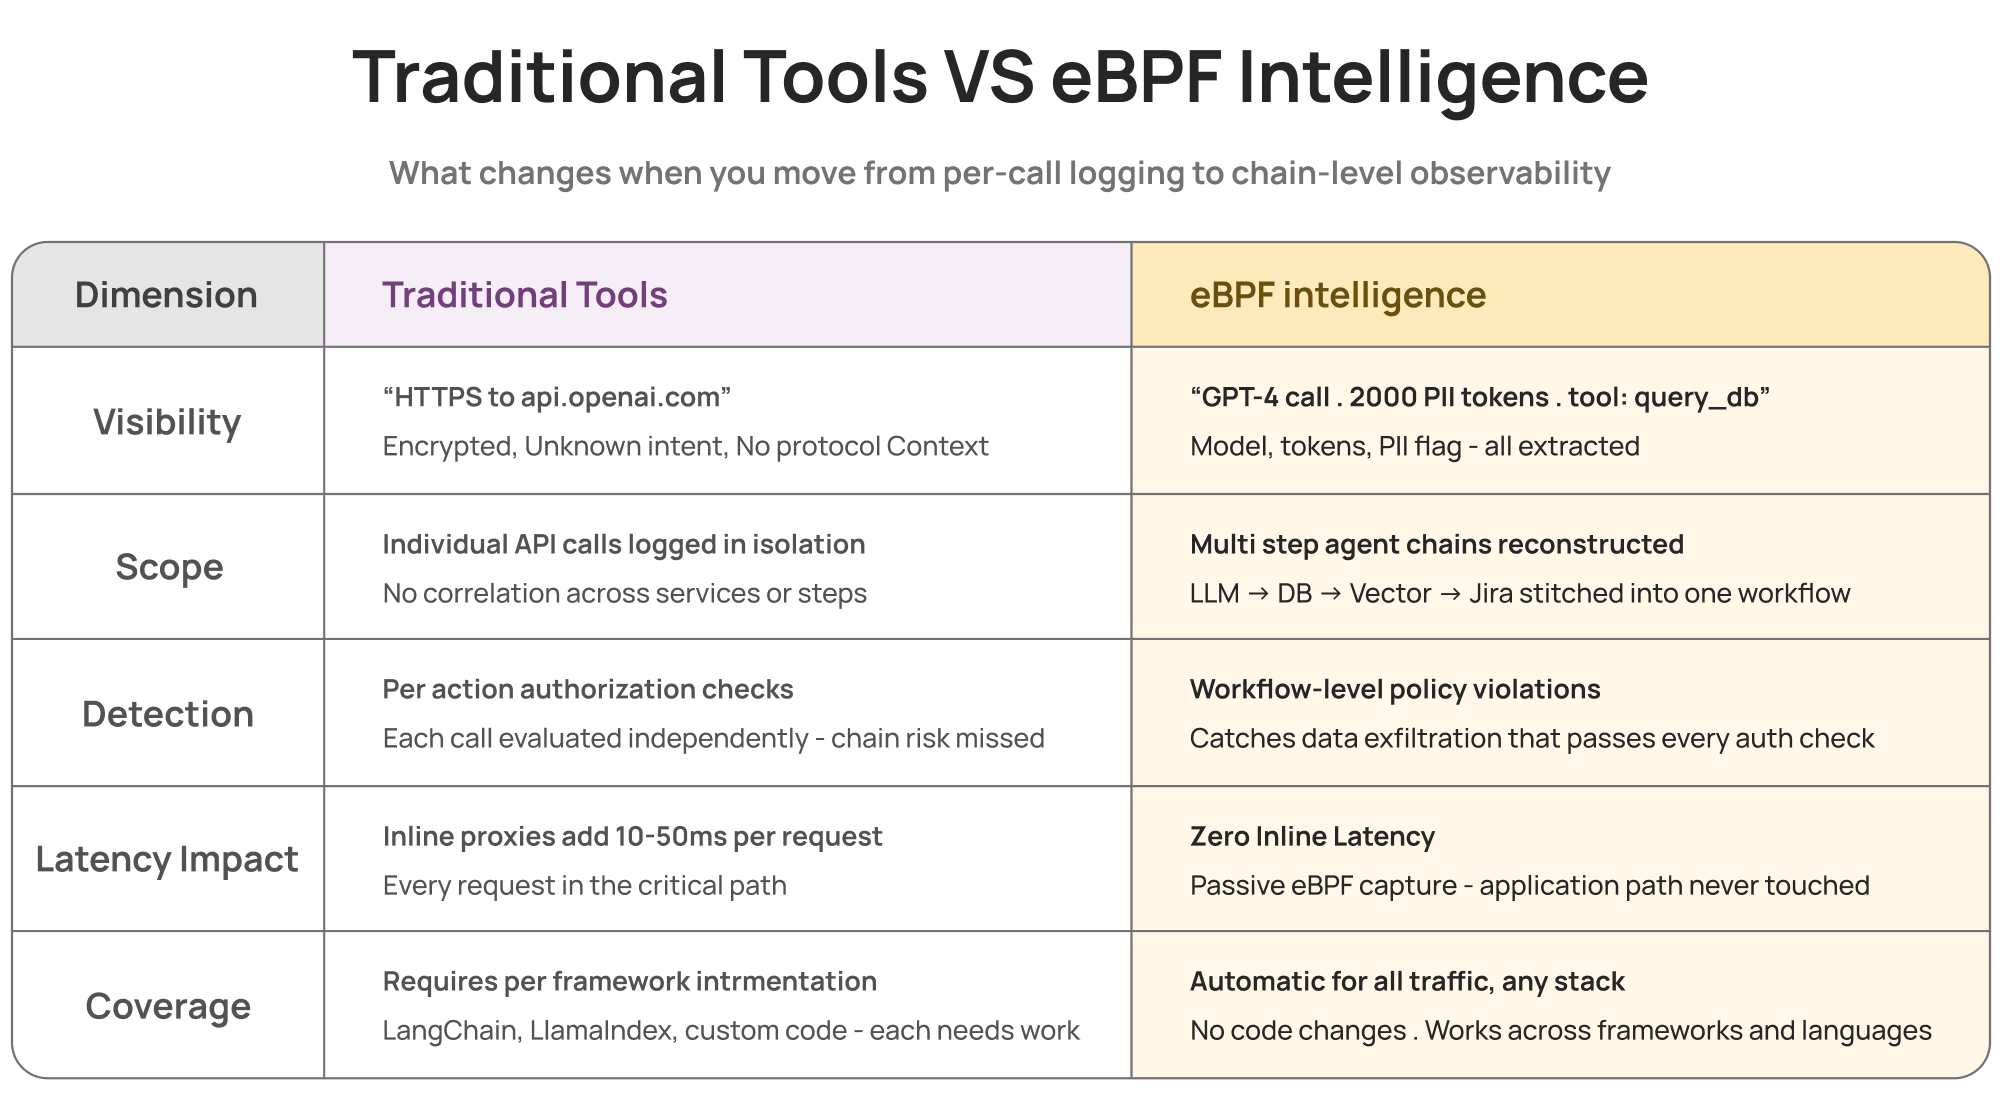 Traditional tools see calls. eBPF intelligence sees chains.
The agents are here. The intelligence layer shows what they're actually doing.